


Kutepova, I., Rehm, C.D., & Friend, S.J. (2023). UK Chickpea Consumption Doubled from 2008/09–2018/19. Nutrients, 15(22), 4784. doi:10.3390/nu15224784
Abstract:
Background: Only 9% of individuals in the United Kingdom (UK) meet the recommendation for dietary fibre intake. Little is known about chickpea consumption in the UK. Methods: Chickpea intake trends and sociodemographic patterns were analysed using the National Diet and Nutrition Survey Rolling Programme data collected from 2008/09 to 2018/19 among 15,655 individuals ≥1.5 years completing a four-day food diary. Chickpea consumers were identified based on a list of chickpea-containing foods, with the most consumed foods being hummus, boiled chickpeas, chickpea flour, and low/reduced-fat hummus. Micronutrient and food group intakes were compared between chickpea consumers and non-consumers; the Modified Healthy Dietary Score was also assessed, which measures adherence to UK dietary recommendations. Results: Chickpea consumption increased from 6.1% (2008–2012) to 12.3% (2016–2019). Among 1.5–3 years, consumption increased from 5.7% to 13.4%, and among 19–64 years, consumption increased from 7.1% to 14.4%. The percentage of individuals eating chickpeas was higher among individuals with higher incomes and more education. Healthy-weight adults were more likely to consume chickpeas compared to those who were overweight or obese. Compared to both bean and non-bean consumers, chickpea consumers ate significantly more dietary fibre, fruits and vegetables, pulses, nuts, and less red meat and processed meat products. Chickpea consumers also had a higher Modified Healthy Dietary Score. Conclusions: In the UK, chickpea consumption more than doubled from 2008/09 to 2018/19. Chickpea consumers had a higher diet quality than non-consumers.
Taylor, J. R. N., Rehm, C. D., L. de Kock, H., Donoghue, S., Johnson, A., Thompson, C., & Berezhnaya, Y. (2023). South African Consumers’ Knowledge, Opinions and Awareness of Whole Grains and Their Health Benefits: A Cross-Sectional Online Survey. Nutrients, 15(16), 3522. doi.org/10.3390/nu15163522
Abstract
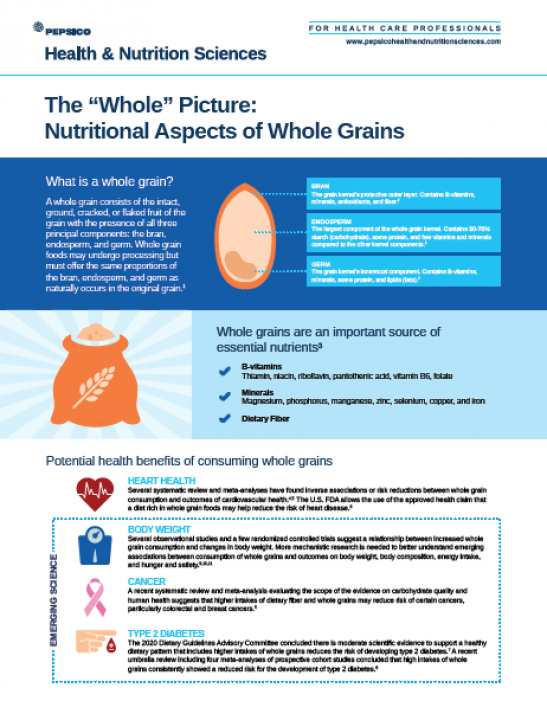
Evidence indicates that whole-grain food consumption reduces the risk of cardiovascular disease, type-2 diabetes, and some cancers. Increasing whole-grain consumption in developing countries is likely to significantly benefit the health of the population. However, there is very limited information on consumer whole-grain knowledge, attitudes, and behaviors in developing countries. An online cross-sectional survey was conducted among 1000 South African consumers with sufficient income to make food purchase choices and who were generally representative in terms of gender, age, and ethnicity. Most respondents (64%) were confident of their whole-grain knowledge. However, 60% of all participants selected incorrect definitions of whole grains. Whilst most correctly identified common cereals as whole grains, at most 50% of participants correctly identified common whole-grain foods. Also, whilst most (67%) thought that they were consuming enough whole grains, the majority (62%) underestimated the recommended level of consumption. Furthermore, respondent knowledge regarding whole-grain food attributes and the health benefits of whole-grain consumption was generally poor. Clearly, consumer-focused strategies are needed in developing countries to increase whole-grain food consumption to help the broader population achieve a healthy and sustainable diet. Actions proposed include: simple-to-understand information on whole-grain content relative to recommendations on food product labels, the provision of whole-grain foods in school nutrition schemes, and coordinated social and behavior change communication initiatives.
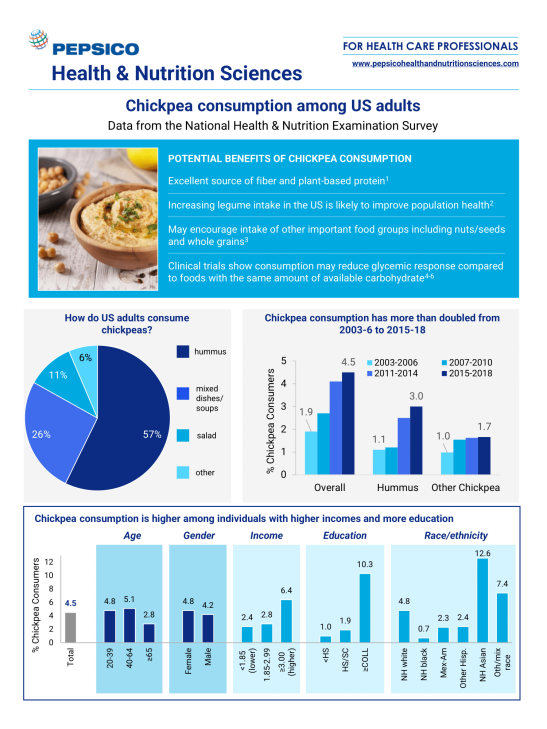
Rehm, C. D., Goltz, S. R., Katcher, J. A., Guarneiri, L. L., . . . Maki, K. C. (2023) Trends and Patterns of Chickpea Consumption among United States Adults: Analyses of National Health and Nutrition Examination Survey Data. The Journal of Nutrition, 153(5), 1567-1576. doi:10.1016/j.tjnut.2023.03.029
Abstract:
Background: Chickpeas are an affordable and nutrient-dense legume, but there is limited United States data on consumption patterns and the relationship between chickpea consumption and dietary intakes.
Objectives: This study examined trends and sociodemographic patterns among chickpea consumers and the relationship between chickpea consumption and dietary intake.
Methods: Adults consuming chickpeas or chickpea-containing foods on 1 or both of the 24-h dietary recalls were categorized as chickpea consumers. Data from NHANES 2003-2018 were used to evaluate trends and sociodemographic patterns in chickpea consumption (n = 35,029). The association between chickpea consumption and dietary intakes was compared to other legume consumers and nonlegume consumers from 2015-2018 (n = 8,342).
Results: The proportion of chickpea consumers increased from 1.9% in 2003-2006 to 4.5% in 2015-2018 (P value for trend < 0.001). This trend was consistent across age group, sex, race/ethnicity, education, and income. In 2015-2018, chickpea consumption was highest among individuals with higher incomes (2.4% among those with incomes <185% of the federal poverty guideline compared with 6.4% with incomes ≥300%), education levels (1.0% for less than high school compared with 10.2% for college graduates), physical activity levels (1.9% for no physical activity compared with 7.7% for ≥430 min of moderate-equivalent physical activity per week), and those with better self-reported health (1.7% fair/poor compared with 6.5% for excellent/very good, P-trend < 0.001 for each). Chickpea consumers had greater intakes of whole grains (1.48 oz/d for chickpea consumers compared with 0.91 for nonlegume consumers) and nuts/seeds (1.47 compared with 0.72 oz/d), less intake of red meat (0.96 compared with 1.55 oz/d), and higher Healthy Eating Index scores (62.1 compared with 51.2) compared with both nonlegume and other legume consumers (P value < 0.05 for each).
Conclusions: Chickpea consumption among United States adults has doubled between 2003 and 2018, yet intake remains low. Chickpea consumers have higher socioeconomic status and better health status, and their overall diets are more consistent with a healthy dietary pattern.
Drewnowski, A., Gonzalez, T. D., & Rehm, C. D. (2022). Balanced hybrid nutrient density score compared to Nutri-Score and health star rating receiver operating characteristic curve analyses. Frontiers in Nutrition, 9. doi:10.3389/fnut.2022.867096
Abstract:
Background: Nutrient profiling (NP) models that are used to assess the nutrient density of foods can be based on a combination of key nutrients and desirable food groups. Objective: To compare the diagnostic accuracy of a new balanced hybrid nutrient density score (bHNDS) to Nutri-Score and Health Star Rating (HSR) front-of-pack systems using receiver operating characteristic (ROC) curve analyses. The diet-level bHNDS was first validated against Healthy Eating Index (HEI-2015) using data from the 2017–18 National Health and Nutrition Examination Survey (2017–18 NHANES). Food-level bHNDS values were then compared to both the Nutri-Score and HSR using ROC curve analyses. Results: The bHNDS was based on 6 nutrients to encourage (protein, fiber, calcium, iron, potassium, and vitamin D); 5 food groups to encourage (whole grains, nuts and seeds, dairy, vegetables, and fruit), and 3 nutrients (saturated fat, added sugar, and sodium) to limit. The algorithm balanced components to encourage against those to limit. Diet-level bHNDS values correlated well with HEI-2015 (r = 0.67; p < 0.001). Food-level correlations with both Nutri-Score (r = 0.60) and with HSR (r = 0.58) were significant (both p < 0.001). ROC estimates of the Area Under the Curve (AUC) showed high agreement between bHNDS values and optimal Nutri-Score and HSR ratings (>0.90 in most cases). ROC analysis identified those bHNDS cut-off points that were predictive of A-grade Nutri-Score or 5-star HSR. Those cut-off points were highly category-specific. Conclusion: The new bHNDS model showed high agreement with two front-of-pack labeling systems. Cross-model comparisons based on ROC curve analyses are the first step toward harmonization of proliferating NP methods that aim to “diagnose” high nutrient-density foods.
Dicklin, M. R., Barron, R., Goltz, S., Warren, J., . . . Maki, K. C. (2022). Fiber and micronutrient intakes among fruit juice consumers and non-consumers in the United Kingdom and France: Modeling the effects of consumption of an orange pomace juice product. Journal of Human Nutrition and Dietetics, 35(6), 1230-1244. doi:10.1111/jhn.12995
Abstract:
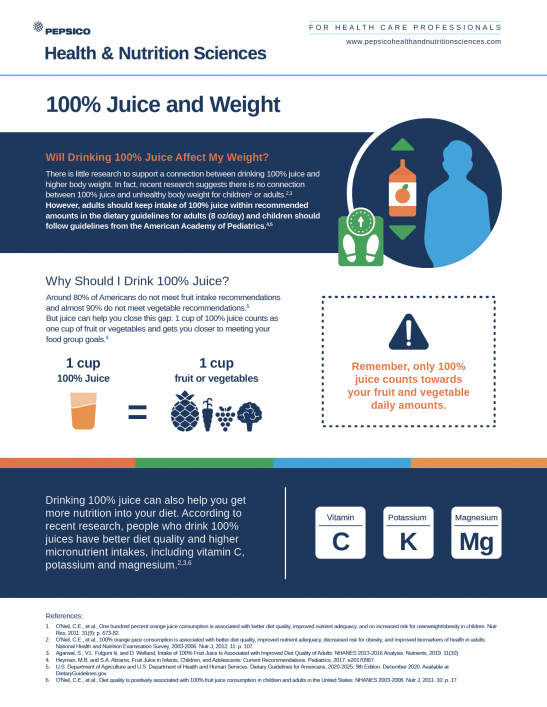
Fruit intake, including consumption of 100% fruit juice, is generally associated with a better diet quality and overall health. However, fruit and vegetable intakes are below recommendations in many countries. Methods The present study examined fruit juice intake and total energy and nutrient intakes according to juice consumption or non-consumption in participants in the National Dietary and Nutrition Survey Rolling Programme 2014–2016 in the UK (n = 2723) and the Individual and National Study on Food Consumption 2006–2007 (n = 4079) in France. Total energy and nutrient intakes were also estimated for scenarios in which orange juice with pomace was either added to the daily diet or replaced 100% orange juice or beverages containing fruit juice. Results Fruit juice consumers had higher intakes of fruits and vegetables than non-consumers, were more likely to reach 5-a-day targets for fruit and vegetable consumption, and had significantly higher intakes of folate, vitamin C, potassium, magnesium, and fibre. Juice consumers also had higher total energy and sugar intakes, but lower body mass index than non-juice consumers. Modelling consumption of orange juice with pomace increased fibre and potassium intakes in orange juice consumers, and also increased fibre, most micronutrients, and 5-a-day achievements in non-juice consumers. Conclusions These national survey results demonstrate that fruit juice consumers in the UK and France had higher intakes of fruits and vegetables than fruit juice non-consumers, and significantly higher intakes of several micronutrients and fibre. Furthermore, modelling of consumption of orange juice with pomace increased fibre and select micronutrient intakes, particularly among fruit juice non-consumers.
Rao, E. S., Yadav, R., Rizwana, Lalmuanpuia, C., . . . Meena, P. M. (2022). Impact of nutrition education on whole grains consumption amongst primary and middle school children in Delhi. Food Science and Technology, 10(2), 23 – 33. doi:10.13189/fst.2022.100202
Abstract:
Imparting nutrition education in schools is an effective tool for inculcating healthy eating behavior in early childhood, which will bestow lifelong positive health implications. Ignorance, illiteracy, lack of nutrition knowledge, and inappropriate nutritional practices and dietary traditions influence the nutritional status of children. This study assesses the existing knowledge, attitude, and practices prevalent amongst the school children (6-14 years) in the consumption of whole grains and examines the impact of nutritional intervention on them. 22% of participants were from primary school in the age group of 6-10 years, and 78% were from middle school between the ages of 11-14 years. Total percentage of girl students was 84% against boys, which was 16%. Nutrition education was imparted to the school children through visual presentation on the importance of consuming whole grains, structure and composition of whole grains, difference between refined and whole grains, food sources, nutritional importance, rich sources of dietary and soluble fibre, besides promoting digestive health and wellness. Self-designed fun nutrition games and food quizzes were employed to engage with the school students. In the pre-assessment survey, the middle school students showed significantly (p≤0.05) higher knowledge than primary school students. Although after implementing the nutrition education program in the post-assessment survey, an increase in knowledge about whole grains was observed both in primary as well as middle school students. However, no significant difference was seen in the knowledge acquisition between male and female students in pre or post-nutrition intervention assessment. The present study showed an incremental rise in the knowledge and attitude of primary and secondary school children in the age group of 6-14 years in all aspects of whole-grain education. Therefore, this intervention showed that in order to bridge the gap of nutrition literacy among school-going children, integrating nutrition education into the school curriculum can be an effective tool for inculcating healthy eating behavior in early childhood.
Smirnova, D. V., Rehm, C. D., Fritz, R. D., Kutepova, I. S., . . . Berezhnaya, Y. A. (2022). Vitamin D status of the Russian adult population from 2013 to 2018. Scientific Reports, 12, 16604. doi:10.1038/s41598-022-21221-4
Abstract:
Vitamin D deficiency is widespread globally, however available data for the Russian adult population is fragmented. This cross-sectional study used secondary data for individuals undergoing testing for vitamin D concentrations from 2013 to 2018 by InVitro laboratory. 25(OH)D serum concentration was determined using chemiluminescent microparticle immunoassay. The mean, median, and proportion with severe, deficient, insufficient and sufficient 25-hydroxyvitamin D (25(OH)D) concentrations were estimated. Splines examined the effect of latitude on 25(OH)D concentrations. Data were available for 30,040 subjects age ≥ 18 years. 24.2% of the sampled population had sufficient (30–< 150 25(OH)D ng/mL), 34% deficient (10–19.9 ng/mL) and 5.6% severely deficient (< 10 ng/mL) status. Average 25(OH)D concentrations were highest among 30–44 years and lowest amongst older adults; females had modestly higher values. Concentrations were 15% higher in fall/summer vs. winter/spring. A non-linear relationship was observed by latitude; the highest 25(OH)D concentrations were observed near 54°N, decreasing at more southern latitudes for women and more northern latitudes for both sexes. These results are comparable to other Northern European publications and limited Russian samples demonstrating low concentrations. Acknowledging that nationally-representative and randomly sampled data are needed, the present data suggest the burden may be high and identifies some population sub-groups and geographic areas with a higher potential deficiency of vitamin D.
Greenberg, D., Drewnowski, A., Black, R., Weststrate, J. A., & O'Shea, M. (2021). A progressive nutrient profiling system to guide improvements in nutrient density of foods and beverages. Frontiers in Nutrition, 8, doi:10.3389/fnut.2021.774409
Abstract:
Improving the nutrient density of processed foods is one way to bring the global food supply closer to the WHO Sustainable Development Goals. Nutrient profiling (NP) has emerged as the preferred method of monitoring the progress toward product innovation and reformulation. This paper presents PepsiCo Nutrition Criteria (PNC), a new internal NP model that was designed to guide and monitor improvements in nutrient density and overall nutritional quality of foods and beverages. The new PNC NP model assigns food products into four classes of increasing nutritional value, based on the content of nutrients to limit, along with nutrients and ingredients to encourage. The nutrient standards used for category assignment followed those developed by global dietary authorities. Standards are proposed for calories, sodium, added sugars, saturated, and industrially produced trans fats. Also included are minimum values for food groups to encourage, low-fat dairy, and for country-specific gap nutrients. Internal use of the NP model has spurred product changes that are consistent with WHO goals for industry transparency. An audited review of company products showed that 48% met added sugar, 65% met sodium, and 71% met saturated fat goals. By the end of 2020, in the top 26 regions in which products are sold, 48% of the total sales volume of global beverages had 100 kcal or less from added sugars per 355 ml serving representing 80% of beverage volume and over 90% of food volume sold globally. The PNC NP model is not consumer-facing but is specifically intended for internal use to motivate stepwise and incremental product innovation and reformulation. Transparent and published NP models further WHO goals of engaging industry stakeholders in the (re)formulation of processed foods and beverages consistent with public health goals.
Roark, E. K., Rehm, C. D., & Sherry, C. L. (2022). Potential for front of pack labeling exposure to impact US dietary choices: A population-based cross-sectional study using NHANES 2017–2018. Nutrients, 14(14), 2995. doi:10.3390/nu14142995
Abstract:
In recent years, front-of-pack nutrition labeling (FOPL) schemes have proliferated, but the components of the diet subject to FOPL have not been described. This study quantified the proportion and elements of the diet that would be subject to FOPL in the US. The 2017–2018 National Health and Nutrition Examination Survey (n = 7121; age ≥2 year) 24-h dietary recalls were used to identify foods/beverages subject to FOPL. The proportion of dietary energy and additional dietary constituents subject to FOPL was estimated. Overall, 57% of dietary energy would be subject to FOPL. Individuals consuming more away-from-home meals had lower exposure to FOPL. Adults with a healthy-weight and those consuming a more healthful diet had more exposure to FOPL. Protein, sodium, potassium, whole fruit, vegetables, and unprocessed meats were less subject to FOPL as compared to total sugars, added sugars, calcium, fruit juice, milk, yogurt, nuts/seeds and whole grains. Because less than 60% of the diet would be impacted by FOPL, implementation of such a policy may have limited reach for the US diet and demonstrates some inconsistencies with current dietary guidance regarding the under- and over-representation of key food groups and nutrients.
Brauchla, M., Dekker, M. J., & Rehm, C. D. (2021). Trends in vitamin C consumption in the United States: 1999–2018. Nutrients, 13(2), 420. doi:10.3390/nu13020420
Abstract:
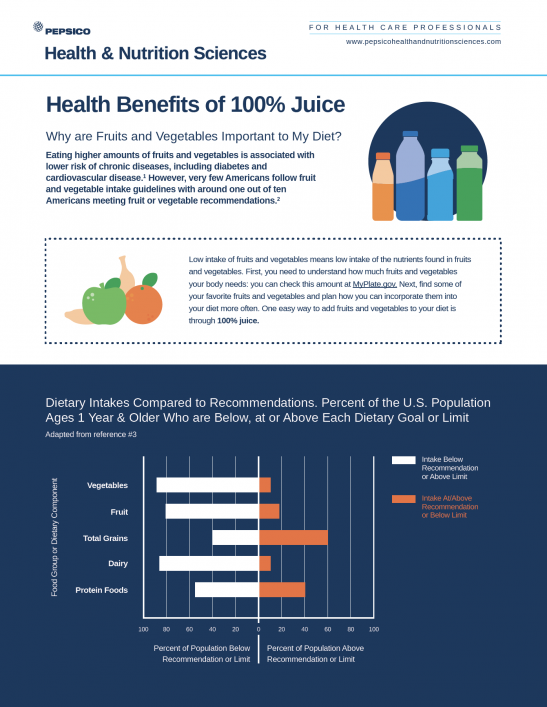
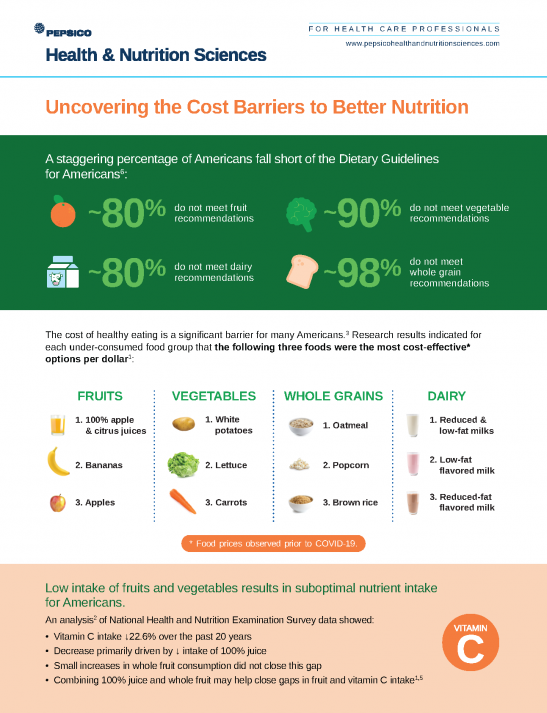
Low intakes of fruits and vegetables have resulted in suboptimal intakes of several micronutrients, including vitamin C. This cross-sectional study used data from 84,902 children/adults (≥1 y) who completed a 24-h dietary recall as part of the United States National Health and Nutrition Examination Survey (1999–2018). Mean vitamin C intakes from foods/beverages were calculated as were trends in major food/beverage sources of vitamin C. Percentages below the Estimated Average Requirement (EAR) were estimated. Overall, mean vitamin C consumption declined by 23% (97–75 mg/d; p-value for trend < 0.001). 100% fruit juice was the leading source of vitamin C (25.6% of total or 21.7mg/d), but this declined by 48% (25–13 mg/d; p-value for trend < 0.001). Whole fruit increased among children/adolescents (+75.8%;10–17 mg/d; p-value for trend < 0.001), but not adults, while the vegetable contribution was generally unchanged. The proportion of the population below the EAR increased by 23.8% on a relative scale or 9 percentage points on an absolute scale (38.3–47.4%). Declines in vitamin C intake is driven largely by decreases in fruit juice coupled with modest increases in whole fruit. Due to associations between vitamin C intake and numerous health outcomes these trends warrant careful monitoring moving forward.
Madan, J., Hussain, N., Joshi, S., Mehra, J., . . . Thomas, J. (2021). Understanding whole grain awareness and consumption in select Indian cohorts. Journal Indian Medical Association, 119(1), 88-94.
Abstract:
Background and Introduction: Grains are an integral part of Indian diet. Carbohydrates constitute to 60-70% of total daily calorie intake and grains are the key carbohydrate source. Including whole grains(WG) in the diet for its health benefits is recommended in dietary guidance around the world. There is consistent evidence to support existence of barriers to WG consumption in Indian population but limited evidence assessing their level of awareness and knowledge on WG. Thus, an independent survey was designed for assessing the level of awareness and consumption of WG amongst millennials and nutritionist and dieticians. Data collection and analysis: Tool employed was self-developed questionnaire. SPSS software and MS Excel were used for analysing data. Results: Only 2% of the surveyed millennials were aware of all aspects of WG. Nutritionists and dieticians showed better responses than millennials. Daily WG consumption in millennials was less than 10% (42 g/day) compared to total grain consumption (432g/day) across food categories. 50% nutritionists and dieticians consume oats for breakfast. Conclusion: Results highlight the importance of raising awareness on the knowledge and consumption of WG amongst urban Indian millennials. It also emphasises the need of national recommendations, encouraging consumers to make half of their total grain consumption as WG. A WG stamp from FSSAI for identification of products with considerable amount of WG and campaigns with public-private partnership supported by nutritionist, dietitians, culinary experts can further help in attaining the goal of a WG rich “Sustainable Healthy Diet” for a healthy living
Bharti, R., Marwaha, A., Badshah, T., Sengupta, R., . . . & Bhatia, B. (2021). Effectiveness of a nutritional education intervention focused on iron among school children in National Capital Region and Mumbai. Journal of Clinical and Diagnostic Research, 15(4), OC31-OC36. doi:10.7860/JCDR/2021/46024.14806
Abstract:
Introduction: Anaemia is a major health problem in India. Various studies mention poor nutrition knowledge and education as main factors of malnutrition. Aim: This study aims at assessing the effect of nutritional education on iron among school children. Materials and Methods: A cross-sectional interventional study was undertaken to improve nutrition literacy in schools from April 2018 to February 2019. The outreach platform used was Eat Right School program by Food Safety and Standards Authority of India (FSSAI). A study tool employed was data collection using self-developed questionnaire for pre and post-intervention knowledge assessment. School children from Delhi NCR and Mumbai participated in this study. Knowledge intervention was done on 5 key elements related to iron including role, sources, iron deficiency anaemia, iron absorption and knowledge of fortification. Chi-square test was applied for comparison. Results: It was found that 54% (n=18,626) of school children studied were in the age group 11-14 years. From 27355 participants who reported the gender, 58.1% (n=15899) were males and 41.9% (n=11456) were females. Comparison of pre and post-intervention assessment revealed that percentage of students knowing importance/role of iron increased from 27.30% to 59.50%, iron deficiency anaemia from 34.03% to 59.85%, sources of iron from 25.20% to 51.70%, iron absorption from 36.00% to 61.2% and knowledge of fortification from 55.4% to 76.9%. Thus, significant shift (p≤0.001) in all the parameters was observed; improvement in scores ranged from 21.5% to 32.20% with highest increase seen in understanding the role of iron. Conclusion: Results of the study reject the null hypothesis leading to acceptance of alternate hypothesis. The alternate hypothesis highlights the role of nutrition education in improving the nutritional literacy of school children in the area of iron and iron deficiency anaemia. Results of the current study increased the knowledge of children on all parameters related to iron education module. Thus, nutritional literacy is imperative in improving nutritional status and adolescent age-group is the window of opportunity to correct it.
Chu Y. F., Wang S., Liu F., Mathews R., & Chen J. (2020). Foreword: Overview of symposium on whole grains, dietary fiber, and public health. Nutrition Reviews, 78(S1), 1-5. doi:10.1093/nutrit/nuz066
Mitchell, D. C., Marinangeli, C., Pigat, S., Bompola, F., . . . Rumney, J. (2021). Pulse intake improves nutrient density among US adult consumers. Nutrients, 13(8), 2668. doi:10.3390/nu13082668
Abstract:
The objective was to examine trends in pulse (dry beans, dry peas, chickpeas and lentils) intake over a 10-year period and to compare nutrient intakes of pulse consumers and non-consumers to better understand the impact of pulse consumption on diet quality in the US population. NHANES 2003–2014 data for respondents (≥19 years) with 2 days of intake was used to evaluate trends in pulse intake. Pulse consumers were identified as those NHANES respondents who consumed pulses on one or both days. Differences in energy adjusted nutrient intakes between non-consumers and consumers were assessed. There were no significant trends in pulse intakes for the total population or for pulse consumers over the 10-year period. In 2013–2014, approximately 27% of adults consumed pulses with an intake of 70.9 ± 2.5 g/day over 2 days, just slightly <0.5 cup equivalents/day. At all levels of consumption, consumers had higher (p < 0.01) energy adjusted intakes of fiber, folate, magnesium. Higher energy adjusted intakes for potassium, zinc, iron and choline and lower intakes of fat were observed for consumers than for non-consumers at intakes ≥69.4 ± 1.01 g/day. These data suggest that pulse consumption in the US population may result in better diet quality with diets that are more nutrient dense than those without pulses.
Lockyer, S., Cade, J., Darmon, N., Flynn, M., . . . Buttriss, J. L. (2020). Proceedings of a roundtable event ‘Is communicating the concept of nutrient density important?’. Nutrition Bulletin, 45(1), 74-97. doi:10.1111/nbu.12421
Abstract:
The British Nutrition Foundation held a 1-day roundtable event to gather views from a wide range of stakeholders on the relevance and importance of the concept of nutrient density in supporting and motivating people to make healthier dietary choices. The opportunities and barriers associated with the use of this concept were also explored. The roundtable involved experts from research, public health nutrition, dietetics, retail and nutrition science communication, and this report describes the main themes emerging from the discussions. High obesity prevalence rates indicate that, on average, we are consuming too many calories relative to energy requirements; yet, the quality of our diets, with respect to certain vitamins and minerals and fibre, seems to be falling somewhat short of recommendations. Addressing this issue may require a more holistic approach than the current focus on restricting single nutrients prevalent in public health messaging internationally. Most members of the roundtable felt that communicating the concept of nutrient density may help in encouraging healthier food choices and dietary patterns that are higher in nutritional quality. However, while nutrient profiling has been used to guide front-of-pack labelling and in restricting the advertising of less healthy foods to children, there is a lack of consensus on the precise definition of a ‘nutrient dense’ food or which nutrients should be used as markers of the ‘healthiness’ of foods/drinks, and the term seems to be poorly understood by consumers and health professionals alike. Therefore, further work is required if tools around this concept are to be developed to try and successfully promote behaviour change.
Mitchell, E. S., Musa-Veloso, K., Fallah, S., Lee, H. Y., . . . Gibson, S. (2020). Contribution of 100% fruit juice to micronutrient intakes in the United States, United Kingdom and Brazil. Nutrients, 12(5), 1258. doi:10.3390/nu12051258
Abstract:
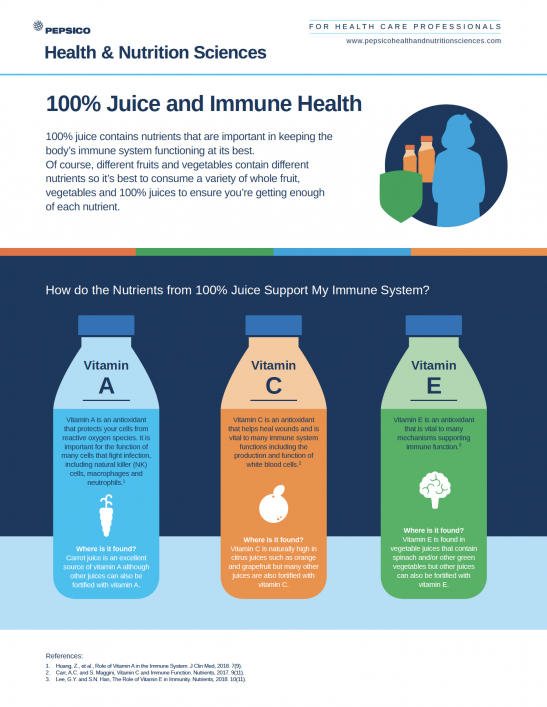
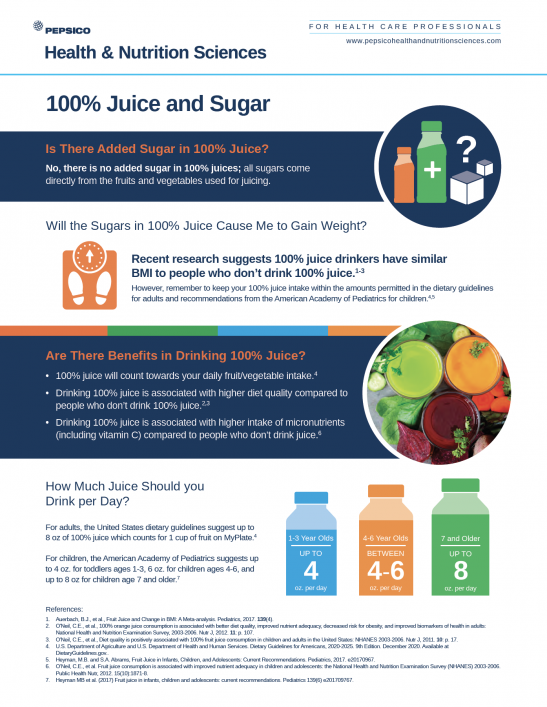
The contribution of 100% fruit juice (FJ) to the total daily intakes of energy, sugars, and select vitamins and minerals and to the recommended dietary allowances (RDAs) or adequate intake (AI) of these micronutrients was assessed in individuals reporting the consumption of 100% FJ in the national dietary intake surveys of the United States (U.S.; n = 8661), the United Kingdom (UK; n = 2546) and Brazil (n = 34,003). Associations of 100% FJ intake with the odds of being overweight or obese also were assessed. Data from the U.S. National Health and Nutrition Examination Survey (2013–2014), the UK National Diet and Nutrition Survey (2012–2014), and Brazil’s Pesquisa de Orçamentos Familiares (2008–2009) were used, and all analyses were limited to individuals reporting consumption of 100% FJ on at least one day of the dietary intake survey. Approximately 34%, 37%, and 42% of individuals surveyed reported the consumption of 100% FJ on at least one day of the dietary intake survey in the U.S., UK, and Brazil, respectively, and the average daily intakes of 100% FJ were 184 g, 130 g, and 249 g, respectively. Across the 3 countries, 100% FJ contributed to 3–6% of total energy intakes, 12–31% of total sugar intakes, 21–54% of total vitamin C intakes, 1–12% of total vitamin A intakes, 4–15% of total folate intakes, 7–17% of total potassium intakes, 2–7% of total calcium intakes, and 4–12% of total magnesium intakes. In a multivariate logistic regression model, juice intake was associated with a significant reduction in the odds of being overweight or obese in UK adults (OR = 0.79; 0.63, 0.99), and significant increases in the odds of being overweight or obese in UK children (OR = 1.16; 1.01, 1.33) and Brazilian adults (OR = 1.04; 1.00, 1.09). Nutrient contributions of 100% FJ vary according to regional intake levels. In all three countries studied, 100% FJ contributed to more than 5% of the RDAs for vitamin C and folate. In the U.S. and Brazil, 100% FJ contributed to more than 5% of the RDA for magnesium and more than 5% of the AI for potassium.
Murphy, M. M., Barraj, L. M., Brisbois, T. D., & Duncan, A. M. (2020). Frequency of fruit juice consumption and association with nutrient intakes among Canadians. Nutrition and Health, 26(4), 277-283. doi:10.1177/0260106020944299
Abstract:
Background: In Canada, studies on consumption of 100% fruit juice and nutrient intakes are limited. Aim: This study aimed to evaluate nutrient intakes and adequacy of intake by frequency of fruit juice consumption. Methods: Individuals ≥1 year (n = 34,351) participating in the Canadian Community Health Survey, 2004 with a 24-hour dietary recall and reported usual frequency of fruit juice consumption (assumed to be 100% juice) were categorized by frequency of consumption as <0.5, ≥0.5 to <1.5, or ≥1.5 times/day. Results: More frequent consumption of fruit juice (≥0.5 times/day) was associated with higher intakes of total fruits and vegetables, whole fruits, energy, total sugars, vitamin C and potassium. More frequent consumption of fruit juice was associated with improved intake adequacy of vitamin C for adults. Conclusions: Fruit juice consumption contributes to increased intakes of vitamin C and potassium as well as energy and total sugars, thus presenting a trade-off for consumers to balance.
Vieux, F., Maillot, M., Rehm, C. D., Barrios, P., & Drewnowski, A. (2020). Opposing consumption trends for sugar-sweetened beverages and plain drinking water: Analyses of NHANES 2011–16 data. Frontiers in Nutrition, 7, 587123. doi:10.3389/fnut.2020.587123
Abstract:
Background: Choosing water in place of sugar-sweetened beverages (SSB) can reduce added sugars while maintaining adequate hydration. The present goal was to examine 2011–16 time trends in SSB vs. water consumption across US population subgroups. Methods: Dietary intake data for 22,716 persons aged >4 years came from two 24-h dietary recalls in successive cycles of the National Health and Examination Survey (NHANES 2011–16). Water intakes (in mL/d) from plain water (tap and bottled) and from beverages (SSB and not-SSB) were the principal outcome variables. Intakes were analyzed by age group, income to poverty ratio (IPR), and race/ethnicity. Time trends by demographics were also examined. Results: SSB and water intakes followed distinct social gradients. Most SSB was consumed by Non-Hispanic Black and lower-income groups. Most tap water was consumed by Non-Hispanic White and higher-income groups. During 2011–16, water from SSB declined from 322 to 262 mL/d (p < 0.005), whereas plain water increased (1,011–1,144 mL/d) (p < 0.05). Groups aged <30 years reduced SSB consumption (p < 0.0001) but it was groups aged >30 years that increased drinking water (p < 0.001). Non-Hispanic White groups reduced SSB and increased tap water consumption. Non-Hispanic Black and lower income groups reduced SSB and increased bottled water, not tap. Conclusion: The opposing time trends in SSB and water consumption were not uniform across age groups or sociodemographic strata. Only the non-Hispanic White population reduced SSB and showed a corresponding increase in tap water. Lower-income and minority groups consumed relatively little plain drinking water from the tap.
Vieux, F., Maillot, M., Rehm, C. D., Barrios, P., & Drewnowski, A. (2020). Trends in tap and bottled water consumption among children and adults in the United States: Analyses of NHANES 2011-16 data. Nutrition Journal, 19, 10. doi:10.1186/s12937-020-0523-6
Abstract:
Background: Dietary Guidelines for Americans 2015–20 recommend choosing water in place of sugar-sweetened beverages (SSB). This study examined water consumption patterns and trends among children and adults in the US. Methods: Dietary intake data for 7453 children (4-18y) and 15,263 adults (>19y) came from two 24 h dietary recalls in three cycles of the National Health and Nutrition Examination Survey (NHANES 2011–2016). Water was categorized as tap or bottled (plain). Other beverages were assigned to 15 categories. Water and other beverage intakes (in mL/d) were analyzed by sociodemographic variables and sourcing location. Consumption time trends from 2011 to 2016 were also examined. Total water intakes from water, other beverages and moisture from foods (mL/d) were compared to Dietary Reference Intakes (DRI) for water. Results: Total dietary water (2718 mL/d) came from water (1066 mL/d), other beverages (1036 mL/d) and from food moisture (618 mL/d). Whereas total water intakes remained stable, a significant decline in SSB from 2011 to 2016 was fully offset by an increase in the consumption of plain water. The main sources of water were tap at home (288 mL/d), tap away from home (301 mL/d), and bottled water from stores (339 mL/d). Water and other beverage consumption patterns varied with age, incomes and race/ethnicity. Higher tap water consumption was associated with higher incomes, but bottled water was not. Non-Hispanic whites consumed most tap water (781 mL/d) whereas Mexican Americans consumed most bottled water (605 mL/d). Only about 40% of the NHANES sample on average followed US recommendations for adequate water intakes. Conclusion: The present results suggest that while total water intakes among children and adults have stayed constant, drinking water, tap and bottled, has been replacing SSB in the US diet.
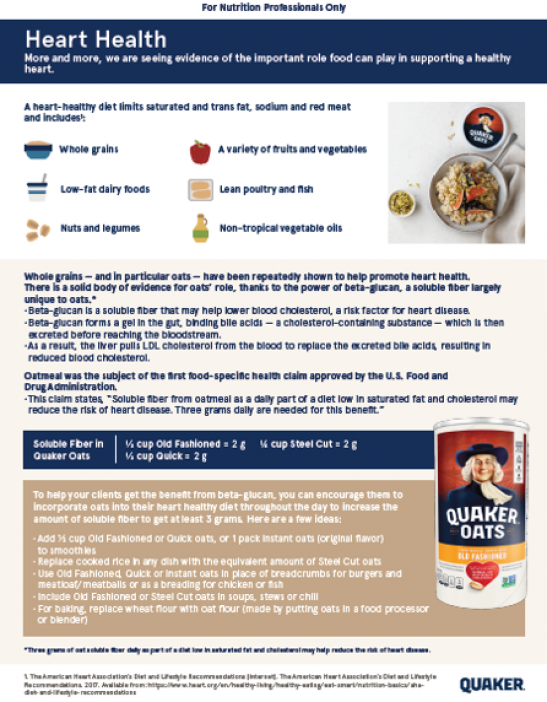
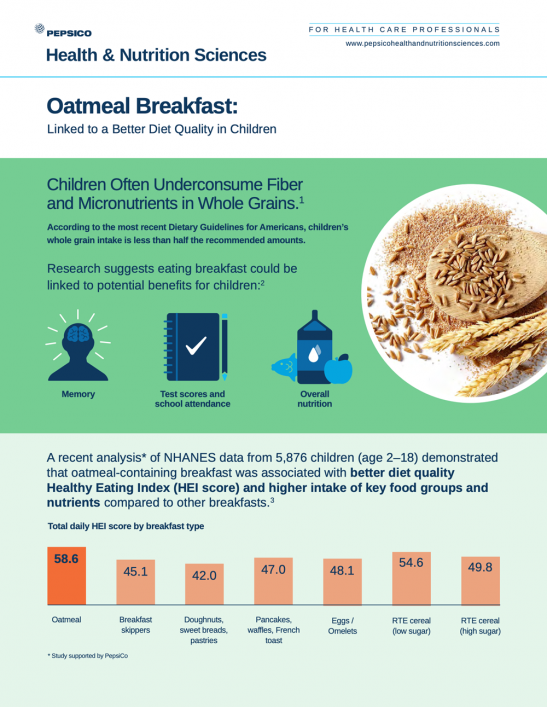
Fulgoni, V. L., Brauchla, M., Fleige, L., & Chu, Y. (2019). Oatmeal-containing breakfast is associated with better diet quality and higher intake of key food groups and nutrients compared to other breakfasts in children. Nutrients, 11(5), 964. doi:10.3390/nu11050964
Abstract:
Oatmeal is a whole grain (WG) food rich in fiber and other nutrients. The study objective was to compare diet quality and nutrient intake of children consuming oatmeal breakfasts to those of children consuming other breakfasts using the National Health and Nutrition Examination Survey (NHANES) 2011–2014. Dietary intake data from 5876 children aged 2–18 years were divided by breakfast food consumption: oatmeal breakfasts, “Doughnuts, sweet rolls, pastries”, “Pancakes, waffles, French toast”, “Eggs and omelets”, “Ready-to-eat cereal, lower sugar”, and “Ready-to-eat cereal, higher sugar” were used to assess diet quality and intake of food groups and nutrients using the USDA Healthy Eating Index-2015 (HEI-2015), Food Patterns Equivalents Database, and Food and Nutrient Database for Dietary Studies, respectively. As compared to consumers of other breakfasts or breakfast skippers, oatmeal consumers had consistently higher diet quality (4–16 points higher HEI 2015 total score, p < 0.05), higher WG intake (0.6–1.6 oz eq. higher, p < 0.05), and higher fiber and magnesium intakes compared to consumers of most other breakfasts or breakfast skippers. The results show that children consuming oatmeal breakfasts have better diet quality and increased intake of key nutrients compared to breakfast skippers and other breakfast consumers and suggest oatmeal may represent an important component of a healthy childhood diet.
Horodyska, J., Pigat, S., Wonik, J., Bompola, F., . . . Gonzalez, T. D. (2021). Impact of sociodemographic factors on the consumption of tubers in Brazil. Nutrition Journal, 20, 54. doi:10.1186/s12937-021-00709-1
Abstract:
Background Although tubers play a significant role in Brazilian agriculture, very little is known about the intake of tubers among the Brazilian population. The objective of this study was to characterize the intake of tubers across Brazil. The types of tubers consumed were quantified, and the impact of geographic and sociodemographic factors was assessed. Methods This cross-sectional study is based on dietary intake data of 33,504 subjects obtained from the Brazilian National Dietary Survey. All tuber containing foods were identified, and the contribution of different tubers to overall tuber consumption in Brazil was quantified. Descriptive analyses assessed the impact of macroregion and sociodemographic characteristics on tuber consumption, and differences in intake were assessed using statistical tests. Lastly, the dietary intakes of tuber consumers and non-consumers were compared after adjusting for energy and covariates to determine if there were any major differences in dietary intakes between the two groups. Results Fifty-five percent of the Brazilian population consumed tubers, which differed by macroregion. The intake of tubers among consumers also differed between macroregions. Overall, rural areas reported significantly higher mean daily intakes of tubers (122 g/day) among tuber consumers than urban areas (95 g/day). Mandioca and potato were the most commonly consumed tubers (59 and 43% prevalence, respectively, on any of the 2 days), while the highest daily intakes amongst tuber consumers across Brazil were noted for sweet potato (156 g/day) and potato (95 g/day). On a macroregion level, among tuber consumers, mandioca had the highest prevalence of consumption in the North (94%), Northeast (83%), and Central-West (68%), while consumption of potatoes was most prevalent in the Southeast (63%) and South (62%). Compared to women, small but significantly higher tuber intakes were noted for males (108 vs. 85 g/day). There were no significant differences in intakes among income quintiles. After adjusting for energy and other covariates, nutrient intakes between tuber and non-tuber consumers were not meaningfully different, with the exception of sodium (+ 6.0% comparing non-tuber to tuber consumers), iron (+ 6.1%), zinc (+ 5.7%), vitamin C (+ 8.3%), riboflavin (+ 9.0%), and folate (+ 7.9%). Conclusions Tuber consumption is influenced by regional and sociodemographic characteristics of the Brazilian population. When looking at energy-adjusted nutrient intakes, diets of tuber consumers have resulted in somewhat lower intakes of some micronutrients, namely riboflavin, folate, vitamin C, iron, sodium, and zinc.
Hunt, K. J., St. Peter, J. V., Malek, A. M., Vrana-Diaz, C., . . . Greenberg, D. (2020). Daily eating frequency in US adults: Associations with low-calorie sweeteners, body mass index, and nutrient intake (NHANES 2007–2016). Nutrients, 12(9), 1-16. doi:10.3390/nu12092566
Abstract:
Studies of relationships between eating frequency and/or timing and energy intake have not examined associations with low-calorie sweeteners (LCS). We assessed the frequency of eating behavior related to LCS consumption emphasizing timing, calorie intake, and body mass index (BMI) among United States (US) adults aged ≥19 years. Using the National Health and Nutrition Examination Survey (NHANES) 2007–2016, we defined eating episodes as food and/or beverage intake within 15 min of one another over the first 24-h dietary recall. We coded items ingested during episodes (n = 136,938) and assessed LCS presence using US Department of Agriculture (USDA) food files. Episode analysis found intakes of foods only (27.4%), beverages only (29.5%), and foods with beverages (43.0%). LCS items were consumed without concurrent calories from other sources in fewer than 2.7% of all episodes. Within participants having normal weight (29.4%), overweight (33.6%) and obese (37.1%) BMIs, LCS consumers (35.2% overall) evidenced: more episodes/day; and fewer: calories, carbohydrates, fats, and protein per episode. Per person, those consuming LCS had lower total calories and higher fiber intake per day. LCS consumption was associated with higher BMI. Number of eating episodes/day and longer hours when eating episodes occurred were also consistently associated with higher BMI. Consuming LCS did not modify these relationships. These results did not show that LCS consumption was associated with increased caloric intake from other dietary sources.
Vieux, F., Maillot, M., Rehm, C. D., Barrios, P., & Drewnowski, A. (2019). The timing of water and beverage consumption during the day among children and adults in the United States: Analyses of NHANES 2011–2016 data. Nutrients, 11(11), 2707. doi:10.3390/nu11112707
Abstract:
Dietary Guidelines for Americans 2015–20 recommend replacing sugar sweetened beverages (SSBs) with plain water in order to promote adequate hydration while reducing added sugar intake. This study explored how water intakes from water, beverages, and foods are distributed across the day. The dietary intake data for 7453 children (4–18 y) and 15,263 adults (>19 y) came from the National Health and Nutrition Examination Survey (NHANES 2011–2016). Water was categorized as tap or bottled. Beverages were assigned to 15 categories. Water intakes (in mL/d) from water, beverages, and food moisture showed significant differences by age group, meal occasion, and time of day. Plain water was consumed in the morning, mostly in the course of a morning snack and between 06:00 and 12:00. Milk and juices were consumed at breakfast whereas SSBs were mostly consumed at lunch, dinner, and in the afternoon. Children consumed milk and juices, mostly in the morning. Adults consumed coffee and tea in the morning, SSBs in the afternoon, and alcohol in the evening. Relatively little drinking water was consumed with lunch or after 21:00. Dietary strategies to replace caloric beverages with plain water need to build on existing drinking habits by age group and meal type.
Musa-Veloso, K., Fallah, S., O’Shea, M., & Chu, Y. F. (2016). Assessment of intakes and patterns of cooked oatmeal consumption in the U.S. using data from the National Health and Nutrition Examination Surveys. Nutrients, 8(8), 503. doi:10.3390/nu8080503
Abstract:
The objective of the present study was to characterize the consumption of cooked oatmeal in the United States (U.S.) and to determine whether oatmeal consumption is associated with body mass index (BMI). To estimate current intakes of cooked oatmeal in the various age and gender population groups, we used dietary intake data from Day 1 of the U.S. 2009–2010 and 2011–2012 National Health and Nutrition Examination Surveys (NHANES). We also used dietary intake data from Day 1 of the U.S. 2003–2012 NHANES to assess associations between intakes of cooked oatmeal (in g/kg body weight) and NHANES cycle (2003–2004, 2005–2006, 2007–2008, 2009–2010, 2011–2012), age category (3–11 years, 12–18 years, 19–44 years, 45 years+), gender, and BMI classification (underweight, normal weight, overweight, or obese), using a multiple linear regression model. A consumer of oatmeal was defined as any individual who reported the consumption of any amount of oatmeal on Day 1 of the survey. Approximately 6% of the total population consumed oatmeal, with an average intake of 238 g/day of cooked oatmeal among consumers. The greatest prevalence of oatmeal consumption was in infants (14.3%) and older female adults (11.1%). Amongst oatmeal consumers, underweight, normal weight, and overweight individuals consumed significantly more oatmeal than obese individuals. Oatmeal was consumed almost exclusively at breakfast and, among consumers, contributed an average of 54.3% of the energy consumed at breakfast across all age groups examined. The association between oatmeal consumption and BMI is interesting and requires confirmation in future clinical studies.